Introducing:
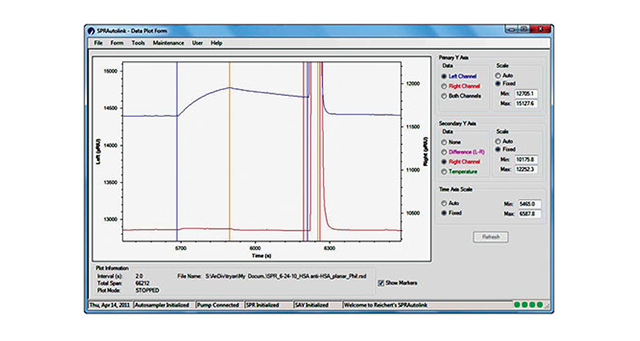
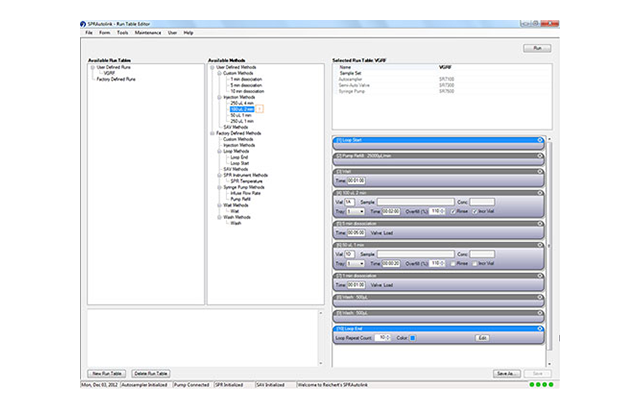
Too often, instrument software packages require more work to master than they should. We want to help change that. XanTec is proud to announce our new Reichert4SPR software - designed by scientists for scientists. The new Reichert4SPR software guides you through the natural workflow of your experiments, from immobilization to method development through scale up of large screening runs. Analysis is intuitive and easy, too. There's no training required, and the idea of "programming" a run that plagues a lot of software simply doesn't exist.
Here's how the new software allows you to focus on the science, while it guides you through the 4SPR experiment:
- Cleaner look and feel—this software is intuitive and easy-to-use, it logically walks you through setup and execution of your experiment. This interface makes the Reichert4SPR perfect for core labs and pharma/biotech companies where there are likely to be multiple users with different levels of experimental expertise. There's minimal input from you and key experimental information required is clearly laid out.
- Organization of projects and experiments—the new software lets you easily setup experiments. In addition, it also lets you build on your last experiment - you only modify the relevant parameters and you can work with similar experimental setups by changing only what you need to.
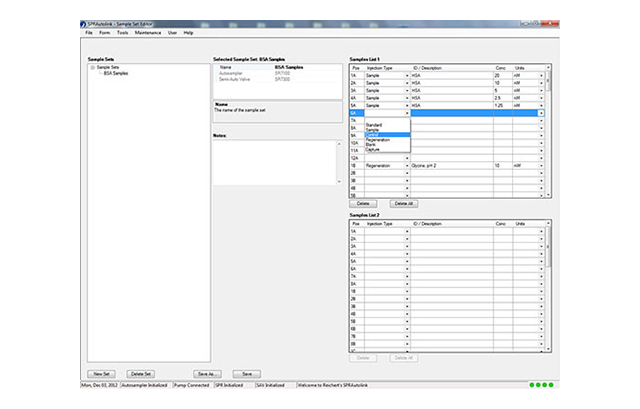
- Easy scale up. When you're ready for a full run, you can quickly specify sample names, initial concentrations and dilutions. The Reichert software calculates required sample amounts and lays out the sample tray for you. If you're using DMSO for your sample stock, DMSO injection setup is also just one click away.
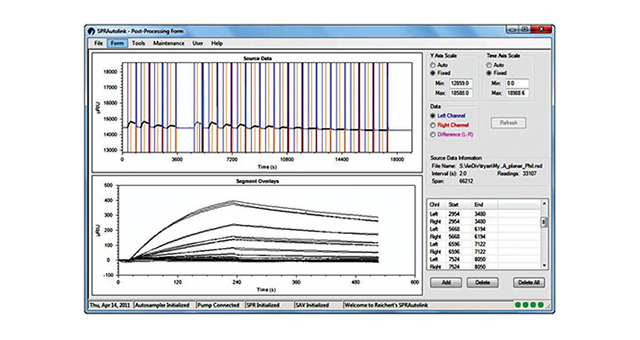
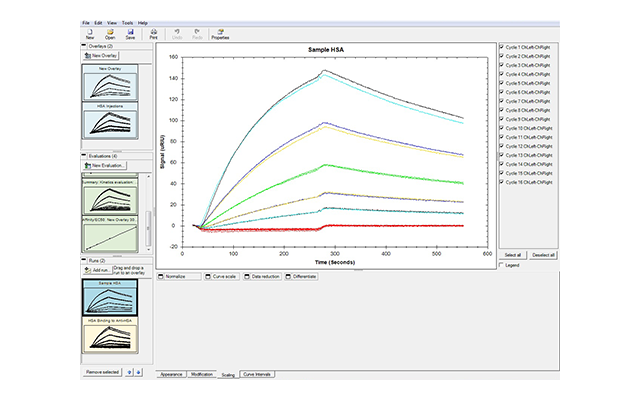
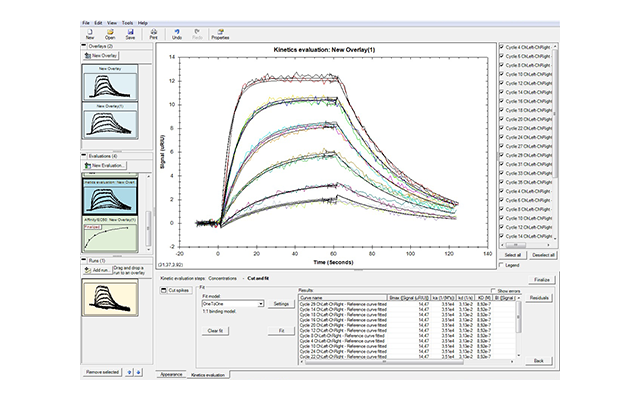
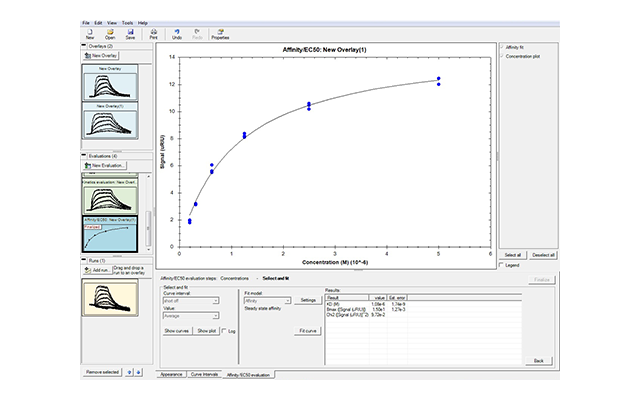
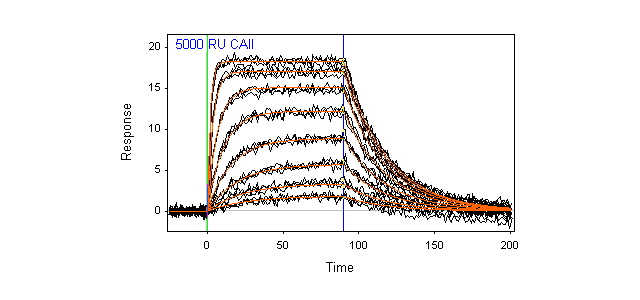
- Fast and easy analysis—data analysis has been streamlined so you can get accurate results faster. When you select Data Analysis, sample injections are automatically overlaid and names and concentrations of analytes are directly exported. Multiple models are available so that even interactions that cannot be fit to a simple 1:1 binding model can be analyzed. The software can also be used to obtain affinity fits of equilibrium data.
- In addition, this software can support GxP environments and is compliant with 21 CFR Part 11 regulations that set standards and practices for handling and protecting electronic data. This eliminates the need to purchase extra "packages" to ensure compliance. Reichert offers access controls to ensure data integrity, configurable authorization levels for creating & running experiments, options, and data export, logs and audit trails to track modifications and maintain a complete history, and data export in Excel and text formats to link with user documentation and archiving.
Current Reichert4SPR instrument users can upgrade to the new software while maintaining compatibility with the latest data analysis software.


