Introduction
Some certainties seem so self-evident that they are rarely questioned. One such apparent truth is the quasi-irreversible biotin–streptavidin interaction — one of the strongest non-covalent bonds known [1]. In biosensing techniques such as SPR, it is widely used to immobilize a biotin-modified ligand on a sensor chip that has been pre-coated with streptavidin. The advantages are compelling: no chemical activation of the sensor chip is required; immobilization proceeds under gentle, physiological conditions with excellent ligand density control; immobilization can be site-directed when an AviTag is used; and interaction experiments can be started with minimal setup time.
The very stability that makes the bond so reliable is also what prevents reuse: once a biotinylated ligand is captured on a streptavidin surface, it cannot be removed to reload the chip with a new ligand under conditions compatible with biosensing and biotechnological workflows. A practical regeneration would reduce cost and sensor-chip consumption and improve turnaround by minimizing chip replacement, conditioning, and re-equilibration.
The effort to overcome this irreversibility extends well beyond SPR and dates back to the widespread adoption of this interaction in biotechnology, most prominently in bead- or column-based affinity enrichment. Over the past decades it has produced a range of strategies, which fall into four main categories:
- First, the streptavidin–biotin complex can be dissociated using harsh physicochemical conditions, including high-temperature treatment, often combined with detergents or formamide; strongly denaturing solutions such as 8 M guanidine hydrochloride at pH 1.5; and concentrated fluorinated alcohols such as hexafluoroisopropanol [2–4]. These approaches have mainly been evaluated in offline bead- or column-based affinity-enrichment workflows, where recovery of the captured biotinylated material was mostly prioritized over preservation of the streptavidin matrix. A notable exception is the release of biotinylated DNA in water at elevated temperatures, which preserves streptavidin activity and allows the beads to be reused [2].
- Second, the biotin-binding protein is engineered or chemically modified so that the capture can be reversed under milder conditions. Switchavidin, an engineered chicken avidin, forms a stable biotin–avidin–biotin bridge at neutral pH that is removed from the surface by low pH in combination with sodium dodecyl sulfate (SDS) [5–7]. In nitro-avidin, nitration of the binding-site tyrosine renders biotin binding pH-dependent, so that the ligand is retained at acidic pH and released as the pH is raised [8]. In each case reversibility is achieved, but only with a modified protein that is either removed and replaced on each cycle or operates within a restricted pH window.
- Third, biotin is replaced by a lower-affinity analog. Desthiobiotin binds streptavidin reversibly and is typically eluted by competitive displacement with free biotin, whereas 2-iminobiotin binds at alkaline pH and is released under acidic conditions [9,10]. Immobilized on the sensor surface, desthiobiotin can serve as a regenerable anchor for native streptavidin, leaving free binding sites for capture of the biotinylated ligand with the full affinity of biotin [11,12]. Although the intrinsic affinity of the anchor is reduced, bivalent attachment of the streptavidin tetramer can maintain stable capture under typical measurement conditions, with regeneration by a sequence of chaotropic, proteolytic and detergent solutions [12].
- Fourth, the native bond is left intact and streptavidin is instead presented through a separate, regenerable anchor. DNA-directed immobilization introduced this principle [13]; it is commercialized as Cytiva's Biotin CAPture™ and XanTec's RGD200M, which capture an oligonucleotide-conjugated streptavidin through a DNA duplex that is dehybridized on demand [14,15]. On regeneration, the conjugate is removed together with the ligand.
In routine SPR practice, the established options are few — Biotin CAPture and RGD200M by this DNA-directed route, or switchavidin on biotin-modified chips — and each depends on a supplier-specific reagent, whether an engineered protein or an oligonucleotide-conjugated streptavidin.
In this application note, we establish a practical method for dissociating the streptavidin–biotin complex under denaturing conditions on a Reichert 4SPR instrument. The method does not preserve streptavidin activity; instead, it preserves the biotin-functionalized sensor surface, allowing it to be reloaded with fresh streptavidin many times. The workflow requires neither engineered streptavidin nor modified biotin and uses only standard reagents and biotin-coated sensor chips. We demonstrate quantitative removal and reproducible reconstitution of the capture layer and show applicability across three model systems representing small-molecule–protein, protein–protein, and DNA–DNA interactions.
Biotin–streptavidin regeneration
A personal communication [16] described the regeneration of streptavidin–biotin complexes on 2D sensor surfaces using pure DMSO. Given the reputation of the streptavidin–biotin interaction as essentially irreversible, this finding was unexpected and prompted us to test whether the effect could be reproduced and adapted to our sensor platform. The Reichert 4SPR is ideally suited to addressing such questions: its chemically robust fluidics tolerate the high organic-solvent concentrations required.
A BD200M sensor chip — a high-capacity CMD surface pre-modified with biotin — was mounted on a Reichert 4SPR system. After a short equilibration, 100 nM streptavidin was injected and captured on the biotin surface, giving a stable, drift-free baseline. Pulses of 100 % DMSO regenerated the surface, but not reproducibly. Reducing the DMSO content to 90 % and adding 0.5 % Tween 20 and 50 mM phosphoric acid improved regeneration markedly: applied as three short 60 s pulses, this solution regenerated the surface reproducibly. Reducing the DMSO content further was counterproductive, leaving 90 % DMSO as the effective lower limit. The results are shown in Fig. 1.
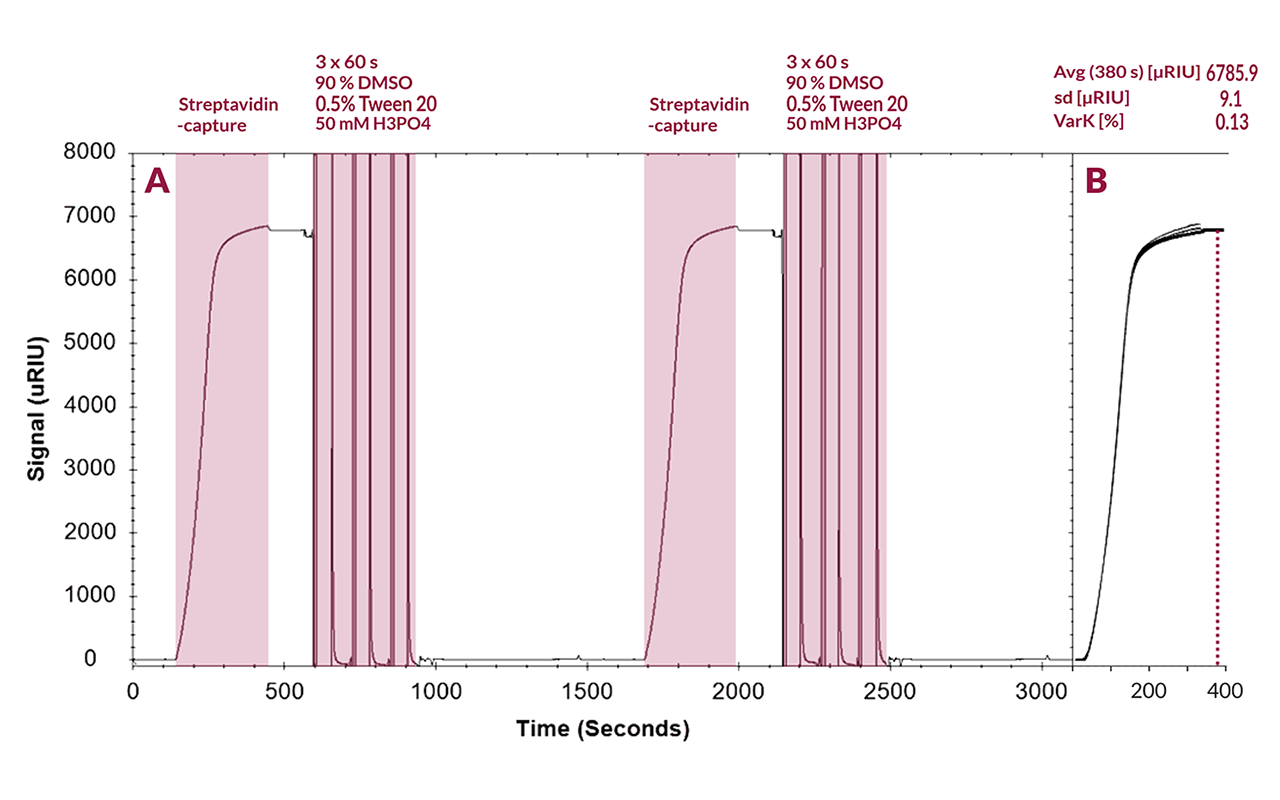
Fig. 1: (A) SPR sensorgram showing two consecutive cycles of streptavidin capture and regeneration. Streptavidin was captured on a BD200M sensor chip and removed using three 60 s pulses of regeneration solution. (B) Overlay of the streptavidin capture phases from 14 consecutive cycles. Capture responses were evaluated at 380 s. Measurements were performed using a Reichert 4SPR instrument.
Fig. 1 A shows the reversible capture of streptavidin on the BD200M matrix. Streptavidin capture produced a response of approximately 6800 µRIU and a stable post-capture signal with no appreciable drift. Three 60 s pulses of the DMSO-based regeneration solution returned the response to the pre-capture baseline, consistent with essentially complete removal of the captured streptavidin. Across 14 capture-and-regeneration cycles, the response measured at 380 s averaged 6785.9 ± 9.1 µRIU (mean ± SD; RSD 0.13 %; n = 14), with no evident decline in capture capacity (Fig. 1 B). This regeneration performance is particularly notable because BD200M is a high-capacity, three-dimensional CMD hydrogel. Unlike a planar coating, the hydrogel presents biotin groups throughout a hydrated flexible polymer network, allowing streptavidin to penetrate the matrix and presumably form multivalent contacts with matrix-bound biotin groups. Such contacts might be expected to hinder complete release.
Nevertheless, the response returned close to the original baseline even after the first regeneration pulse, while the subsequent pulses produced little additional decrease. Over the 14 cycles tested, the constant capture response and the absence of an accumulating residual signal provided no functional evidence of deterioration of the capture matrix. Together, the essentially complete regeneration and highly reproducible capture capacity support subsequent evaluation of the surface in ligand-capture and biomolecular interaction experiments.
Kinetic evaluation
These results demonstrate that streptavidin can be quantitatively removed from a high-capacity, three-dimensional biotin-modified sensor chip such as the BD200M, providing full sensor chip functionality after consecutive regeneration cycles. Whether this capture-and-regeneration strategy is compatible with reliable kinetic measurements, however, remained to be established.
We therefore adapted a workflow previously described for the pH-sensitive avidin variant switchavidin on BD200M sensor chips [17], replacing switchavidin with conventional streptavidin. In this workflow, streptavidin is pre-incubated with the biotinylated ligand before capture on the biotin-presenting sensor surface. This pre-complexation occupies a proportion of the biotin-binding sites with ligand before the complex encounters the sensor matrix, while retaining sites required for surface capture. Without pre-complexation, matrix-bound biotin could occupy multiple binding sites and thereby substantially reduce the capacity of the captured streptavidin to bind the biotinylated ligand; an effect that is more pronounced on 3D than on 2D coatings.
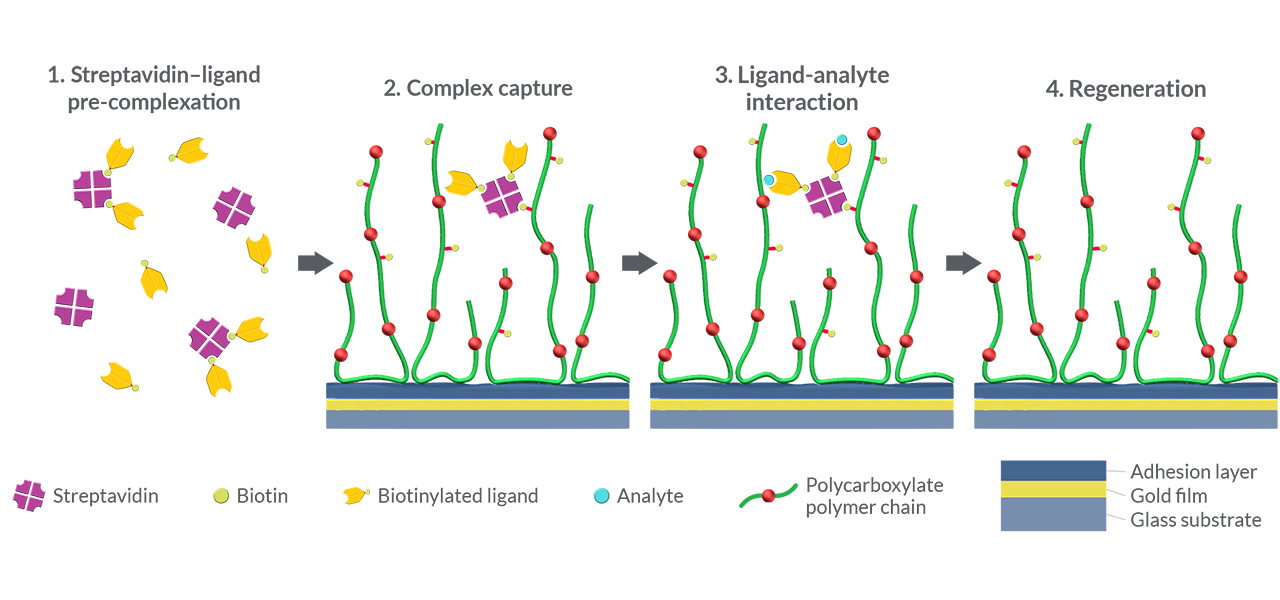
Fig. 2: Schematic workflow for the capture and release of streptavidin–ligand complexes on biotin-modified sensor chips. (1) A monobiotinylated ligand is pre-incubated with streptavidin at a ligand-to-streptavidin molar ratio of approximately 2:1, corresponding to an average occupancy of two of the four biotin-binding sites per tetramer. (2) The resulting complexes are captured on the biotin-modified sensor chip via remaining free binding sites. (3) Analyte binds to the captured ligand. (4) Regeneration removes the captured streptavidin–ligand complexes while leaving the biotin-modified surface ready for the next capture cycle. All illustrations are schematic representations and are not drawn to scale.
For monobiotinylated ligands, we adopted the ligand-to-switchavidin molar ratio of 2:1 identified as optimal by Gunnarsson et al. [17] and applied it to streptavidin. This corresponds to an average occupancy of two of the four biotin-binding sites per tetramer, while retaining binding sites for capture on the sensor surface. The resulting workflow is illustrated in Fig. 2.
This assay architecture formed the basis for the analysis of three model systems: biotinylated IL-2Rα (AviTag) versus IL-2 (protein–protein interaction), bovine carbonic anhydrase II (CA II) versus furosemide (protein–small-molecule interaction), and a 24-mer single-stranded DNA oligonucleotide versus a complementary 9-mer (DNA–DNA interaction). The results are summarized in Tab. 1.
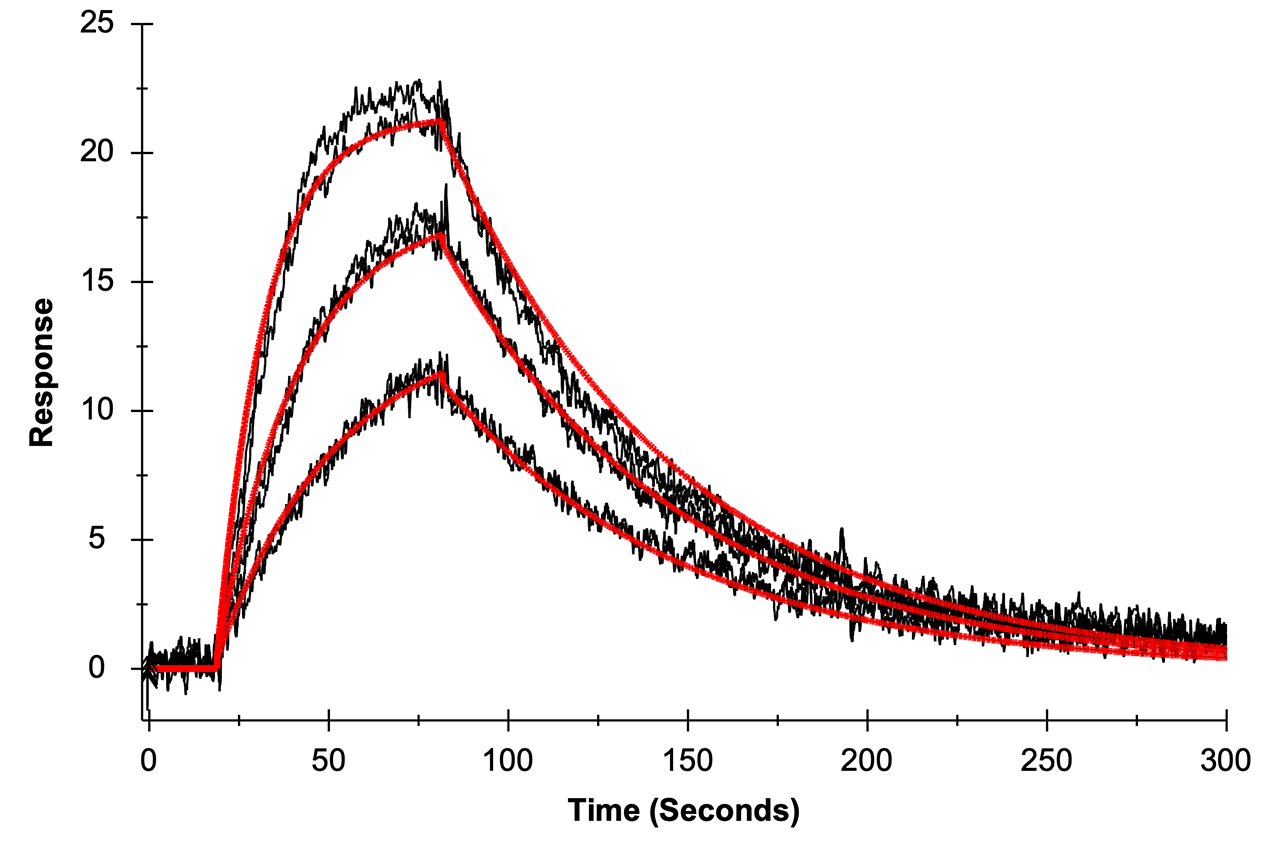
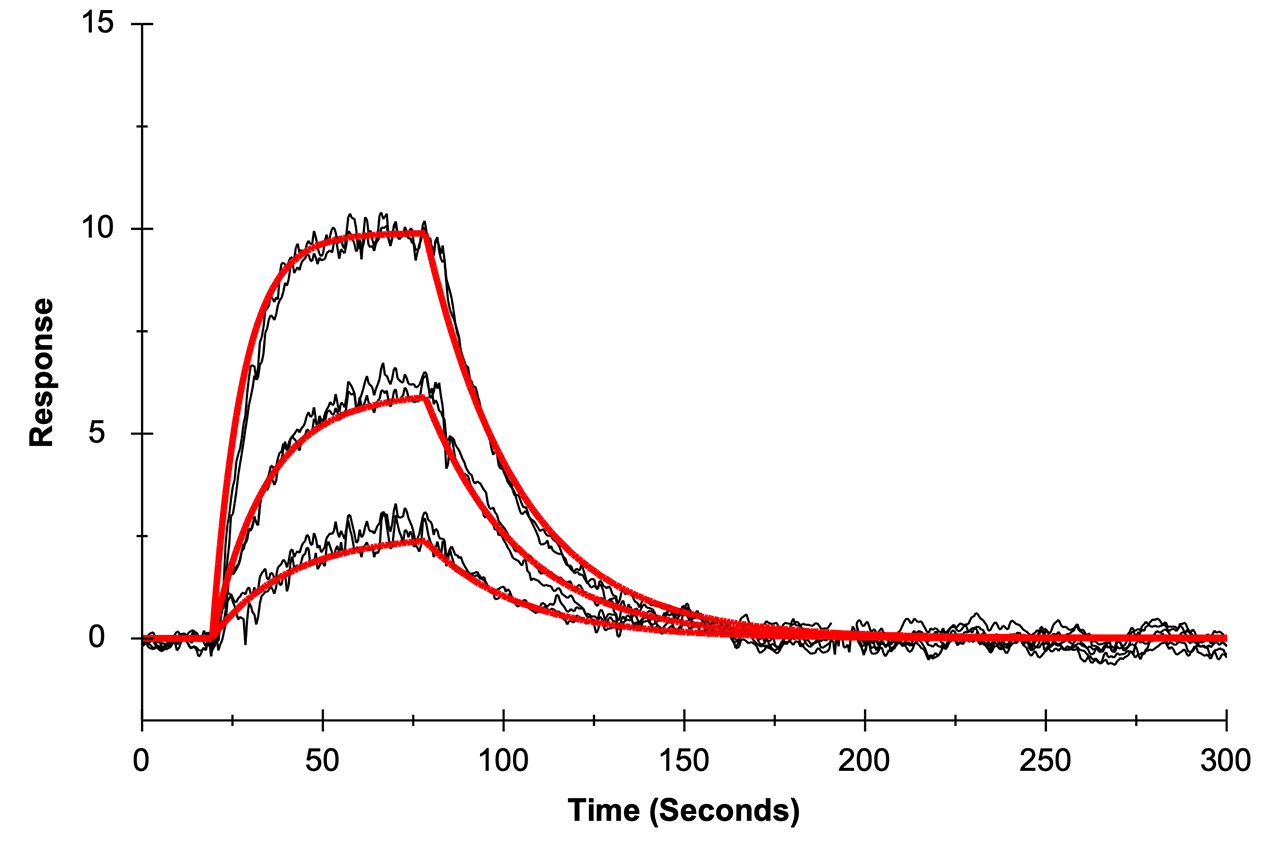
Tab. 1: Kinetic characterization of three model systems on biotin-modified BP and BD200M sensor chips. The sensorgram overlays show the experimental data (duplicate) in black and the 1:1 fit with diffusion correction in red.
| IL-2Rα / IL-2 | DNA / asDNA | CA II / furosemide | |
|---|---|---|---|
| Sensorgrams | 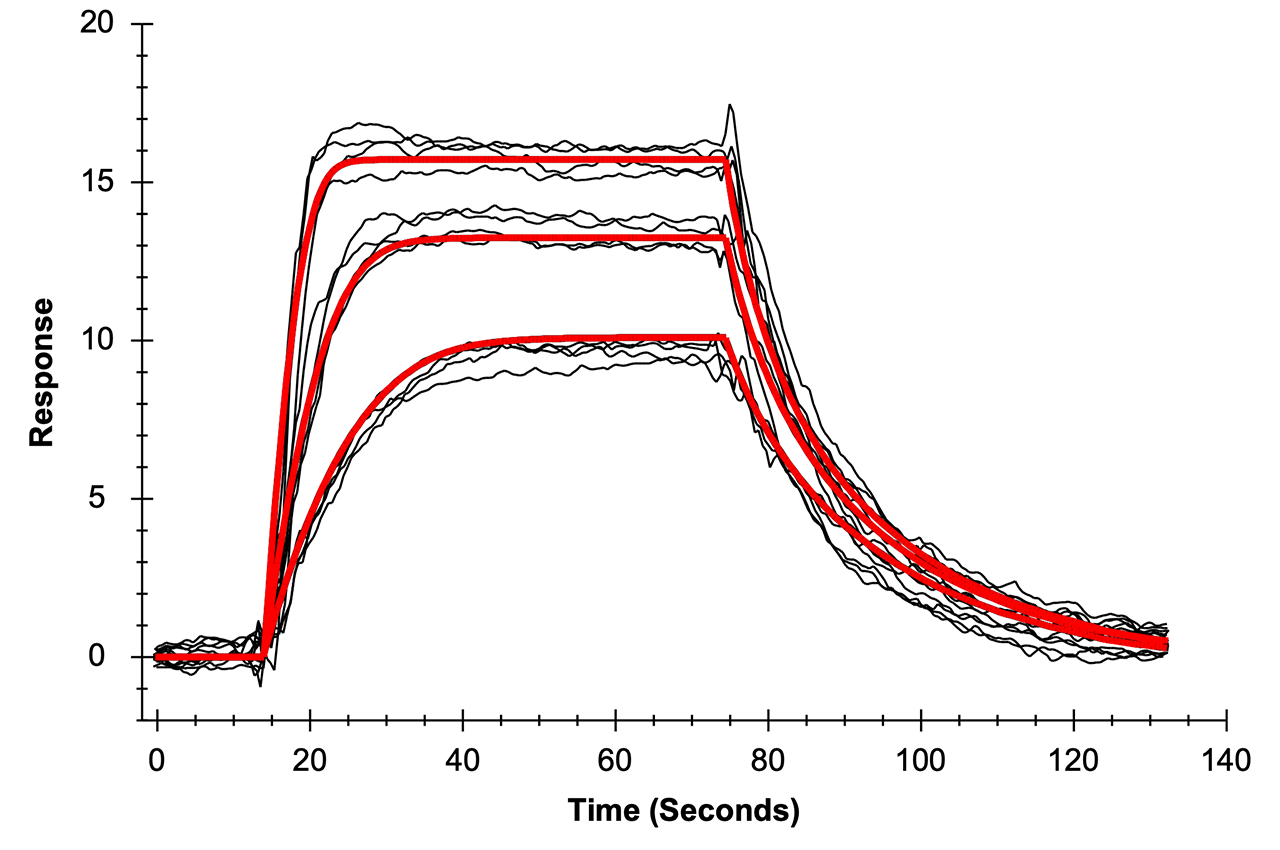 |
 |
 |
| Ligand | IL-2Rα, 25.4 kDa | ssDNA, 24 nt, 7.8 kDa | CA II, 29.0 kDa |
|---|---|---|---|
| Biotinylation | AviTag, site-directed | 5ʹ-biotin, site-directed | NHS ester, N-terminus / lysine side chain |
| Biotin per molecule | 1 | 1 | DOL ≈ 0.3¹ |
| Ligand : SA ratio | 2 : 1 | 2 : 1 | 2 : 1 |
| Sensor chip | BP | BP | BD200M |
| Analyte | IL-2, 15.4 kDa | asDNA, 9 nt, 2.7 kDa | Furosemide, 330.7 Da |
| Concentrations | 50, 25, 12.5 nM | 125, 62.5, 31.25 nM | 3, 1, 0.3 µM |
| ka [M⁻¹ s⁻¹] | 1.5 × 10⁷ | 4.9 × 10⁵ | 2.7 × 10⁴ |
| kd [s⁻¹] | 1.7 × 10⁻¹ | 1.6 × 10⁻² | 3.9 × 10⁻² |
| KD [M] | 1.2 × 10⁻⁸ | 3.2 × 10⁻⁸ | 1.44 × 10⁻⁶ |
| Fitting model | 1:1; χ² 0.45 | 1:1; χ² 0.41 | 1:1; χ² 0.10 |
¹ Chemical biotinylation of CA II was performed with NHS-LC-Biotin at a 0.5:1 molar ratio to protein. The degree of labeling was not determined and is estimated at ~0.3 based on empirical values.
IL-2 showed concentration-dependent binding to captured IL-2Rα, with closely overlapping sensorgrams obtained in two independent runs. Global kinetic analysis yielded an association rate constant of 1.47×10⁷ M⁻¹s⁻¹, a dissociation rate constant of 1.70×10⁻¹ s⁻¹, and an equilibrium dissociation constant of 11.5 nM (χ² = 0.45). Thus, the interaction is characterized by rapid complex formation but also rapid dissociation, corresponding to a dissociative half-life of approximately 4.1 s; both rate constants lie within a factor of two of those reported by SPR for the isolated IL-2Rα ectodomain (ka = 7.8×10⁶ M⁻¹s⁻¹, kd = 0.24 s⁻¹) [18]. The measured affinity agrees well with previously reported values of approximately 10–37 nM for binding of IL-2 to the isolated IL-2Rα subunit [18,19], which is conventionally termed the low-affinity IL-2 receptor, whereas assembly with the β- and γ-chain receptor subunits increases the affinity into the picomolar range.
As a second model system, furosemide was injected at three concentrations over CA II captured on the BD200M surface. The concentration-dependent sensorgrams were well described by a 1:1 interaction model (χ² = 0.1), yielding an association rate constant of 2.7×10⁴ M⁻¹s⁻¹, a dissociation rate constant of 3.9×10⁻² s⁻¹, and an equilibrium dissociation constant of 1.44 µM. The interaction therefore exhibits a moderate association rate and relatively rapid dissociation, corresponding to a dissociative half-life of approximately 18 s. These values agree within a factor of about two with those of a multicenter SPR benchmark study, which reported ka = 6.3 ± 1.4×10⁴ M⁻¹s⁻¹, kd = 6.1 ± 0.6×10⁻² s⁻¹, and KD = 1.0 ± 0.2 µM for the CA II–furosemide interaction [20]. Thus, reversibly captured CA II retained its small-molecule binding activity and enabled reliable kinetic characterization in the low-micromolar affinity range.
As a third model system, a 5ʹ-biotinylated 24-mer DNA ligand presenting a terminal 9-nt target sequence was captured on the BP surface, and hybridization of the fully complementary 9-mer antisense DNA analyte was measured at three concentrations. The concentration-dependent sensorgrams were described by a 1:1 interaction model (χ² = 0.41), yielding apparent rate constants of ka = 4.9×10⁵ M⁻¹s⁻¹ and kd = 1.6×10⁻² s⁻¹, corresponding to a KD of 32 nM. The oligonucleotide pair was derived from the Bio34/7mer model system of Sobek et al. [21,22]: the biotinylated ligand corresponds to a 24-nt truncation of the original 34-mer probe, while the analyte was extended from seven to nine nucleotides, giving a 9-bp duplex. For the unlabeled 7-mer, Sobek et al. reported ka = 4.2×10⁵ M⁻¹s⁻¹, kd = 2.2×10⁻¹ s⁻¹, and KD = 560 nM at 20 °C [21]. The similar association rate and approximately 14-fold slower dissociation are qualitatively consistent with stabilization by the two additional base pairs. However, differences in probe length, duplex position, surface presentation and temperature prevent a direct quantitative comparison.
Discussion
With the surface shown to resist repeated regeneration without loss of capacity, the format could be applied to actual interaction analysis. Taken together, the three model systems show that the regenerable capture format supports kinetic measurements across a broad range of analyte sizes and interaction types — a protein–protein interaction, a protein–small-molecule interaction, and short-oligonucleotide hybridization. The protein-based model systems yielded kinetic parameters broadly consistent with published values, while the DNA model showed behavior qualitatively consistent with stabilization of a longer duplex. Together, the binding responses indicate that the captured ligands remain functional after pre-complexation and capture.
Because this capture format closely follows the strategy introduced previously for the switchavidin-mediated immobilization of biotinylated ligands on biotin-modified sensor chips [17], it also carries similar caveats. Gunnarsson et al. observed a distribution of switchavidin–ligand stoichiometries after pre-incubation [17], and a similar distribution must be expected for streptavidin, although it was not determined here. Complexes with more free binding sites are likely to be captured preferentially and can bridge biotin groups within the matrix, which may contribute to diffusion limitation. Larger ligands are expected to amplify this effect, as bulky complexes penetrate the hydrogel less readily than weakly occupied streptavidin. Oligonucleotide-based capture avoids this mechanism: on RGD200M, oligonucleotide-conjugated streptavidin is anchored through a DNA duplex rather than through a variable number of matrix biotins [15].
Conclusion
We have shown that the native biotin–streptavidin capture can be regenerated directly on commercial biotin SPR chips: three 60 s pulses of a single acidic DMSO solution remove the captured streptavidin quantitatively and reproducibly from the high-capacity 3D matrix (BD200M) over 14 consecutive cycles and also regenerate the low-capacity 2D coating (BP) between kinetic runs. The regenerated surface retains its capture capacity over repeated cycles. Kinetic measurements of the protein-based model systems agree broadly with published values, while the DNA comparison provides qualitative support for the expected stabilization of the longer duplex. The approach achieves this with standard streptavidin on standard biotin surfaces, requiring neither an engineered or chemically modified avidin nor a reduced-affinity biotin analog as described earlier [5–12,17]. A single solution and less than 5 min are sufficient for a complete regeneration cycle.
For SPR users, the gain is a reusable sensor chip that speeds up assay development, allowing fast iteration of assay conditions on a single chip — provided the fluidic system tolerates the regeneration solution. In practice, the risk of diffusion limitation should always be kept low. The 2D BP surface is therefore the more robust choice for this format, preferably combined with site-directed biotinylation of the ligand. Where maximum precision is required, however, conventional streptavidin surfaces remain the more reliable option.
Concerning instrument hardware, the above work illustrates a key strength of the Reichert SPR platform: the chemical robustness of its fluidics against organic solvents, combined with the robust surface chemistry of XanTec bioanalytics. It is precisely this tolerance that made the approach possible — and that allows established assumptions to be tested experimentally, supporting the development of innovative bioanalytical workflows.
Materials
Biotinylated interleukin-2 receptor α (Biotin-IL-2Rα, 25.4 kDa) and interleukin-2 (IL-2, 15.4 kDa) were obtained from ACROBiosystems (Newark, DE, USA). Oligonucleotides were from Integrated DNA Technologies (Coralville, IA, USA; see Tab. 2). Carbonic anhydrase II from bovine erythrocytes (CA II, 29.0 kDa), furosemide (330.7 Da) and sodium azide were purchased from Sigma-Aldrich (Merck KGaA, Darmstadt, Germany); EZ-Link NHS-LC-Biotin and Zeba spin desalting columns (7K MWCO) from Thermo Fisher Scientific (Waltham, MA, USA); recombinant streptavidin (SA, 52.0 kDa) from a commercial supplier; DMSO (Th. Geyer, Renningen, Germany); Tween 20 from Croda (Snaith, UK); and phosphoric acid from Carl Roth (Karlsruhe, Germany). Borate elution buffer (0.1 M sodium borate, 1 M NaCl, pH 9.0) and concentrated stock solutions (10× HBSTE, 10× PBS) were supplied by XanTec bioanalytics (Düsseldorf, Germany). All chemicals were of analytical grade. Buffers were prepared with ultrapure water (18.2 MΩ·cm) and sterile-filtered (0.22 µm) before use. BP and BD200M sensor chips (XanTec bioanalytics) were stored at −20 °C according to the manufacturer's recommendations.
Tab. 2: Oligonucleotides used in this study.
| Oligonucleotide | Role | Length | Sequence |
|---|---|---|---|
| Biotin-DNA | Binding ligand | 24 nt | 5ʹ-/5BiosG/TTT TTG GAA ACT GTA TTG GCA CTG-3ʹ |
| asDNA | Analyte | 9 nt | 5ʹ-CAG TGC CAA-3ʹ |
| Biotin-NM-DNA | Non-binding reference | 24 nt | 5ʹ-/5BiosG/AGC TCC GTG CAT TCA GTG GAT TAA-3ʹ |
Methods
All SPR experiments were performed on a Reichert 4SPR system (Reichert Technologies, Buffalo, NY, USA) at 25 °C with a data collection rate of 10 Hz. SPR sensor chips were preconditioned with three consecutive 60 s injections of borate elution buffer at 50 µL/min when installed for the first time. Data were analyzed with TraceDrawer (version 1.10.1; Ridgeview Instruments AB, Uppsala, Sweden). Sensorgrams were fitted globally to a 1:1 interaction model including a term for diffusion correction.
Biotinylation of CA II
CA II was dissolved in PBS at 2.5 mg/mL (86 µM). NHS-LC-Biotin was dissolved in dry DMSO at 10 mM and added to the protein solution at a CA II:NHS-LC-Biotin molar ratio of 1:0.5 and mixed intensively. The mixture was incubated for 1 h at room temperature without further stirring. Unreacted reagent was removed using Zeba spin desalting columns against PBS, according to the manufacturer's instructions. The protein concentration of the eluate was determined by UV/Vis spectroscopy at 280 nm.
Pre-complexation of biotinylated ligands with streptavidin
Biotin-IL-2Rα (site-directed via AviTag, 7.87 µM; 192.4 pmol) and Biotin-DNA or Biotin-NM-DNA (site-directed, 5ʹ-biotinylated, 10 µM; 500 pmol) were mixed with streptavidin (tetramer, 19.2 µM; 96.2 pmol and 250 pmol, respectively), giving a molar ligand-to-SA ratio of 2:1.
For Biotin-CA II (biotinylated via EZ-Link NHS-LC-Biotin), 300 pmol of total protein (48 µM stock) were mixed with 45 pmol SA. Assuming a degree of labeling (DOL) of 0.3 biotin per CA II molecule, this corresponds to approximately 90 pmol of protein-bound biotin and thus likewise to a biotin-to-SA ratio of 2:1.
All mixtures were incubated for 15 min at room temperature and stored at 4 °C for up to 48 h.
Biotin–streptavidin regeneration
BD200M sensor chips were equilibrated in PBS (10 mM Na₂HPO₄, 2 mM KH₂PO₄, 140 mM NaCl, 3 mM KCl) containing 0.03 % (w/v) sodium azide until a stable baseline was reached. Streptavidin (100 nM) was injected for 5 min at 15 µL/min, giving a capture level of approximately 6800 µRIU; flow channel 4 served as reference. Regeneration was performed with three 60 s injections of a solution containing 90 % (v/v) DMSO, 0.5 % (v/v) Tween 20 and 50 mM H₃PO₄ at 100 µL/min. Fourteen consecutive capture–regeneration cycles were performed on the same sensor chip.
Kinetic interaction analyses
Each newly installed sensor chip was preconditioned with borate elution buffer as stated above and allowed to stabilize afterwards. Before every interaction analysis, the system was primed with five consecutive blank injections. All binding curves were double referenced with several additional blank injections included in the binding experiments described below.
IL-2Rα/IL-2: Measurements were performed on BP sensor chips in HBSTE running buffer (10 mM HEPES, 150 mM NaCl, 0.05 % (v/v) Tween 20, 50 µM EDTA, pH 7.4). The preformed IL-2Rα-streptavidin complex was diluted to 9.1 nM (with respect to IL-2Rα) and captured on flow channels 1–3 by injection for 8 min at 25 µL/min, while flow channel 4 was left free and served as the reference. This resulted in a capture level of approximately 130 µRIU on flow channels 1–3. After baseline stabilization, IL-2 was injected at 50, 25 and 12.5 nM in duplicate (100 µL/min; 60 s association; 240 s dissociation). The surface was regenerated once after completing a full set of analyte concentrations, using the conditions described under Biotin–streptavidin regeneration.
24-mer/9-mer DNA: Measurements were performed on BP sensor chips using HBSTE as running buffer. Following surface conditioning, the preformed SA-DNA complex was captured on the active flow channels 1–3, while the SA-nonbinding reference-DNA complex was captured on flow channel 4 serving as a reference. Both complexes were injected at 84 nM (with respect to the DNA concentration) for 10 min at 10 µL/min, resulting in capture levels of approximately 600 µRIU on both surfaces. To collect kinetic binding data, asDNA was prepared from a 1 mM stock by diluting 2 µL in 198 µL running buffer (10 µM) and this solution further to 1 µM, followed by two-fold serial dilution, and injected in duplicate in order of ascending concentration at 31.25, 62.5 and 125 nM at a flow rate of 70 µL/min. Association and dissociation were monitored for 60 and 240 s, respectively. The ligand was captured once and the complete concentration series was measured on the same surface without intermediate regeneration.
CA II/furosemide: Measurements were performed on BD200M sensor chips. Following preconditioning, the prepared streptavidin-CA II complex (50 nM with respect to CA II) was captured in four consecutive 20 min injections at 9 µL/min to a level of approximately 6000 µRIU, using PBS as running buffer. The buffer was then changed to PBS with 3 % (v/v) DMSO, and the baseline was allowed to re-stabilize before the interaction analysis. Flow channel 4, which received running buffer only, served as the reference. For kinetic binding experiments, furosemide was dissolved in 100 % DMSO at 1 mg/mL (3.02 mM), pre-diluted into PBS to 91 µM (30 µL + 970 µL), and finally diluted in running buffer to 3, 1 and 0.3 µM for duplicate injections (70 µL/min, 60 s association, 300 s dissociation).
Literature
- Weber, P. C., Ohlendorf, D. H., Wendoloski, J. J., & Salemme, F. R. (1989). Structural origins of high-affinity biotin binding to streptavidin. Science, 243(4887), 85–88. https://doi.org/10.1126/science.2911722
- Holmberg, A., Blomstergren, A., Nord, O., Lukacs, M., Lundeberg, J., & Uhlén, M. (2005). The biotin-streptavidin interaction can be reversibly broken using water at elevated temperatures. Electrophoresis, 26(3), 501–510. https://doi.org/10.1002/elps.200410070
- Thermo Fisher Scientific. (2009). Thermo Scientific avidin-biotin technical handbook (Publication No. 1601675). Thermo Fisher Scientific Inc.
- Warnken, U., Schnölzer, M., & Linder, E. (2016). Methods for a quantitative release of biotinylated peptides and proteins from streptavidin complexes. Patent WO 2016/120247 A1. German Cancer Research Center (DKFZ).
- Pollheimer, P., Taskinen, B., Scherfler, A., Gusenkov, S., Creus, M., Wiesauer, P., Zauner, D., Schötterger, W., Schwarzinger, C., Ebner, A., Tampé, R., Stutz, H., Hytönen, V. P., & Gruber, H. J. (2013). Reversible biofunctionalization of surfaces with a switchable mutant of avidin. Bioconjugate Chemistry, 24(10), 1656–1668. https://doi.org/10.1021/bc400087e
- Zauner, D., Taskinen, B., Eichinger, D., Flattinger, C., Ruttman, B., Knoglinger, C., Traxler, L., Ebner, A., Gruber, H. J., & Hytönen, V. P. (2016). Regenerative biosensor chips based on switchable mutants of avidin – A systematic study. Sensors and Actuators B: Chemical, 229, 646–654. https://doi.org/10.1016/j.snb.2016.02.039
- Taskinen, B., Zauner, D., Lehtonen, S. I., Koskinen, M., Thomson, C., Kähkönen, N., Kukkurainen, S., Määttä, J. A. E., Ihalainen, T. O., Kulomaa, M. S., Gruber, H. J., & Hytönen, V. P. (2014). Switchavidin: Reversible biotin–avidin–biotin bridges with high affinity and specificity. Bioconjugate Chemistry, 25(12), 2233–2243. https://doi.org/10.1021/bc500462w
- Morag, E., Bayer, E. A., & Wilchek, M. (1996). Reversibility of biotin-binding by selective modification of tyrosine in avidin. Biochemical Journal, 316(1), 193–199. https://doi.org/10.1042/bj3160193
- Hirsch, J. D., Eslamizar, L., Filanoski, B. J., Malekzadeh, N., Haugland, R. P., Beechem, J. M., & Haugland, R. P. (2002). Easily reversible desthiobiotin binding to streptavidin, avidin, and other biotin-binding proteins: uses for protein labeling, detection, and isolation. Analytical Biochemistry, 308(2), 343–357. https://doi.org/10.1016/S0003-2697(02)00201-4
- Hofmann, K., Wood, S. W., Brinton, C. C., Montibeller, J. A., & Finn, F. M. (1980). Iminobiotin affinity columns and their application to retrieval of streptavidin. Proceedings of the National Academy of Sciences USA, 77(8), 4666–4668. https://doi.org/10.1073/pnas.77.8.4666
- Knoglinger, C., Zich, A., Traxler, L., Poslední, K., Friedl, G., Ruttmann, B., Schorpp, A., Müller, K., Zimmermann, M., & Gruber, H. J. (2018). Regenerative biosensor for use with biotinylated bait molecules. Biosensors and Bioelectronics, 99, 684–690. https://doi.org/10.1016/j.bios.2017.07.033
- Gruber, H. J. (2017). Regenerative biosensor. Patent WO 2017/029194 A1. Johannes Kepler Universität Linz.
- Niemeyer, C. M., Wacker, R., & Adler, M. (2003). Combination of DNA-directed immobilization and immuno-PCR: very sensitive antigen detection by means of self-assembled DNA–protein conjugates. Nucleic Acids Research, 31(16), e90. https://doi.org/10.1093/nar/gng090
- Cytiva. Biotin CAPture Kit / Sensor Chip CAP – product documentation. Cytiva, Uppsala, Sweden.
- XanTec bioanalytics. RGD200M sensor chip – product information. XanTec bioanalytics GmbH, Düsseldorf, Germany.
- Sobek, J. (2026). Functional Genomics Center Zurich, University of Zurich. Personal communication.
- Gunnarsson, A., Stubbs, C. J., Rawlins, P. B., Taylor-Newman, E., Lee, W.-C., Geschwindner, S., Hytönen, V., Holdgate, G., Jha, R., & Dahl, G. (2021). Regenerable biosensors for small-molecule kinetic characterization using SPR. SLAS Discovery, 26(5), 730–739. https://doi.org/10.1177/2472555220975358
- Myszka, D. G., Arulanantham, P. R., Sana, T., Wu, Z., Morton, T. A., & Ciardelli, T. L. (1996). Kinetic analysis of ligand binding to interleukin-2 receptor complexes created on an optical biosensor surface. Protein Science, 5(12), 2468–2478. https://doi.org/10.1002/pro.5560051209
- Rickert, M., Wang, X., Boulanger, M. J., Goriatcheva, N., & Garcia, K. C. (2005). The structure of interleukin-2 complexed with its alpha receptor. Science, 308(5727), 1477–1480. https://doi.org/10.1126/science.1109745
- Papalia, G. A., Leavitt, S., Bynum, M. A., Katsamba, P. S., Wilton, R., Qiu, H., Steukers, M., Wang, S., Bindu, L., Phogat, S., Giannetti, A. M., Ryan, T. E., Pudlak, V. A., Matusiewicz, K., Michelson, K. M., Nowakowski, A., Pham-Baginski, A., Brooks, J., Tieman, B. C., … Myszka, D. G. (2006). Comparative analysis of 10 small molecules binding to carbonic anhydrase II by different investigators using Biacore technology. Analytical Biochemistry, 359(1), 94–105. https://doi.org/10.1016/j.ab.2006.08.021
- Sobek, J., Schauer, S., Rehrauer, H., Fischer, D., Patrignani, A., Landgraf, S., & Schlapbach, R. (2013). Single-molecule interactions studied by using a modified DNA sequencer: A comparison with surface plasmon resonance data. Proceedings of SPIE, 8596, 85960Y. https://doi.org/10.1117/12.2002953
- Sobek, J., Rehrauer, H., Schauer, S., Fischer, D., Patrignani, A., Landgraf, S., Korlach, J., & Schlapbach, R. (2016). Single-molecule DNA hybridisation studied by using a modified DNA sequencer: a comparison with surface plasmon resonance data. Methods and Applications in Fluorescence, 4(1), 015002. https://doi.org/10.1088/2050-6120/4/1/015002
Disclaimer
The results presented were obtained under proprietary procedures described above. Alternative conditions and materials were not assessed and may lead to different outcomes.
Use of XanTec sensor chips does not affect the instrument warranty or any existing service contracts.